The GW Illusion: Not All Flexibility is Created Equal


Not all virtual power plant capacity is created equal. The industry's headline metric — enrolled nameplate capacity — obscures the value that actually shows up on the grid. ev.energy’s CEO Nick Woolley unpacks the metrics utilities should really be measuring.
The U.S. Virtual Power Plant (VPP) market reached 38.6 GW of enrolled nameplate capacity across all technologies in 2025, growing 21% year‑on‑year, according to the Ohm Analytics 2025 VPP Market Report. That number is real, and it represents genuine progress. But it also obscures something important: not all of those gigawatts are created equal. A kilowatt of enrolled EV charging capacity is not the same as a kilowatt of enrolled thermostat capacity. The difference isn't marginal — in our experience running more than 50 programs with energy companies worldwide, it can be an order of magnitude apart.
The VPP industry often talks about a single metric — enrolled nameplate capacity — that conflates wildly different assets into one number. This post unpacks why that matters, and what utilities should be measuring instead.
This post unpacks the physics behind the headline numbers and makes the case that how we measure VPP capacity needs to evolve — from nameplate GW to dispatchable GW and shiftable GWh.
Multiple metrics, very different narratives
To understand what a VPP can actually deliver, you need more than just one number.
Nameplate Capacity (kW) is the maximum instantaneous power draw (or export) of an enrolled device. For an EV charger, this is typically 7.2-11.5 kW, or higher in some cases. For a smart thermostat controlling a central AC unit, it's around 3–5 kW. For a residential battery, it's 5–11.5 kW depending on the system. This is the number the industry reports, and it's the most flattering.
Availability Factor is the fraction of nameplate capacity that is actually dispatchable at any given moment, after accounting for device state (plug-in probability for EVs, state of charge for batteries, HVAC running status for thermostats) and fleet-level diversity (i.e., not all devices are simultaneously available). For EVs, this is typically ~16% of their nameplate capacity; for a dedicated home battery, it can be close to 100%.
After taking the availability factor into account, Dispatchable Capacity (kW) is the power a utility can reliably dispatch within any given time period, accounting for the fact that not every device is running at nameplate when you need it. An EV might not be plugged in. A thermostat can only curtail load that's already running. A battery might be at a low state of charge. Diversity factors are brutal: in our real-world management of millions of charging sessions, the ratio of dispatchable to enrolled nameplate capacity for EVs is typically around 1:7. That means 7.2 kW of enrolled EV capacity yields about 1–1.25 kW of dispatchable capacity at any given moment.
Dispatch Frequency — how many times per month the device can be called. For EVs and batteries, this is effectively daily (30×/month). For smart thermostats, most utility programs limit dispatches to 1–2 events per month to avoid participant fatigue, which dramatically reduces monthly shiftable energy regardless of how well the device performs on any given event day. This is what makes the headline narrative around nameplate capacity most misleading.
Shiftable energy (kWh) is the total energy that can be moved from one period to another over a defined timeframe — a day, a week, a season. This is where the real differentiation between asset types emerges, and where EVs and batteries dramatically outperform other DERs.
A thermostat might reduce load by 1 kW during a demand response (DR) event with reasonable reliability, but that event happens once or twice a month. Multiply it out, and the monthly shiftable energy per device is a fraction of what an EV or battery delivers every single day.
The differences, when you model them across real program configurations, are not marginal - they are structural. The table below illustrates the gap using ev.energy’s standard assumptions:
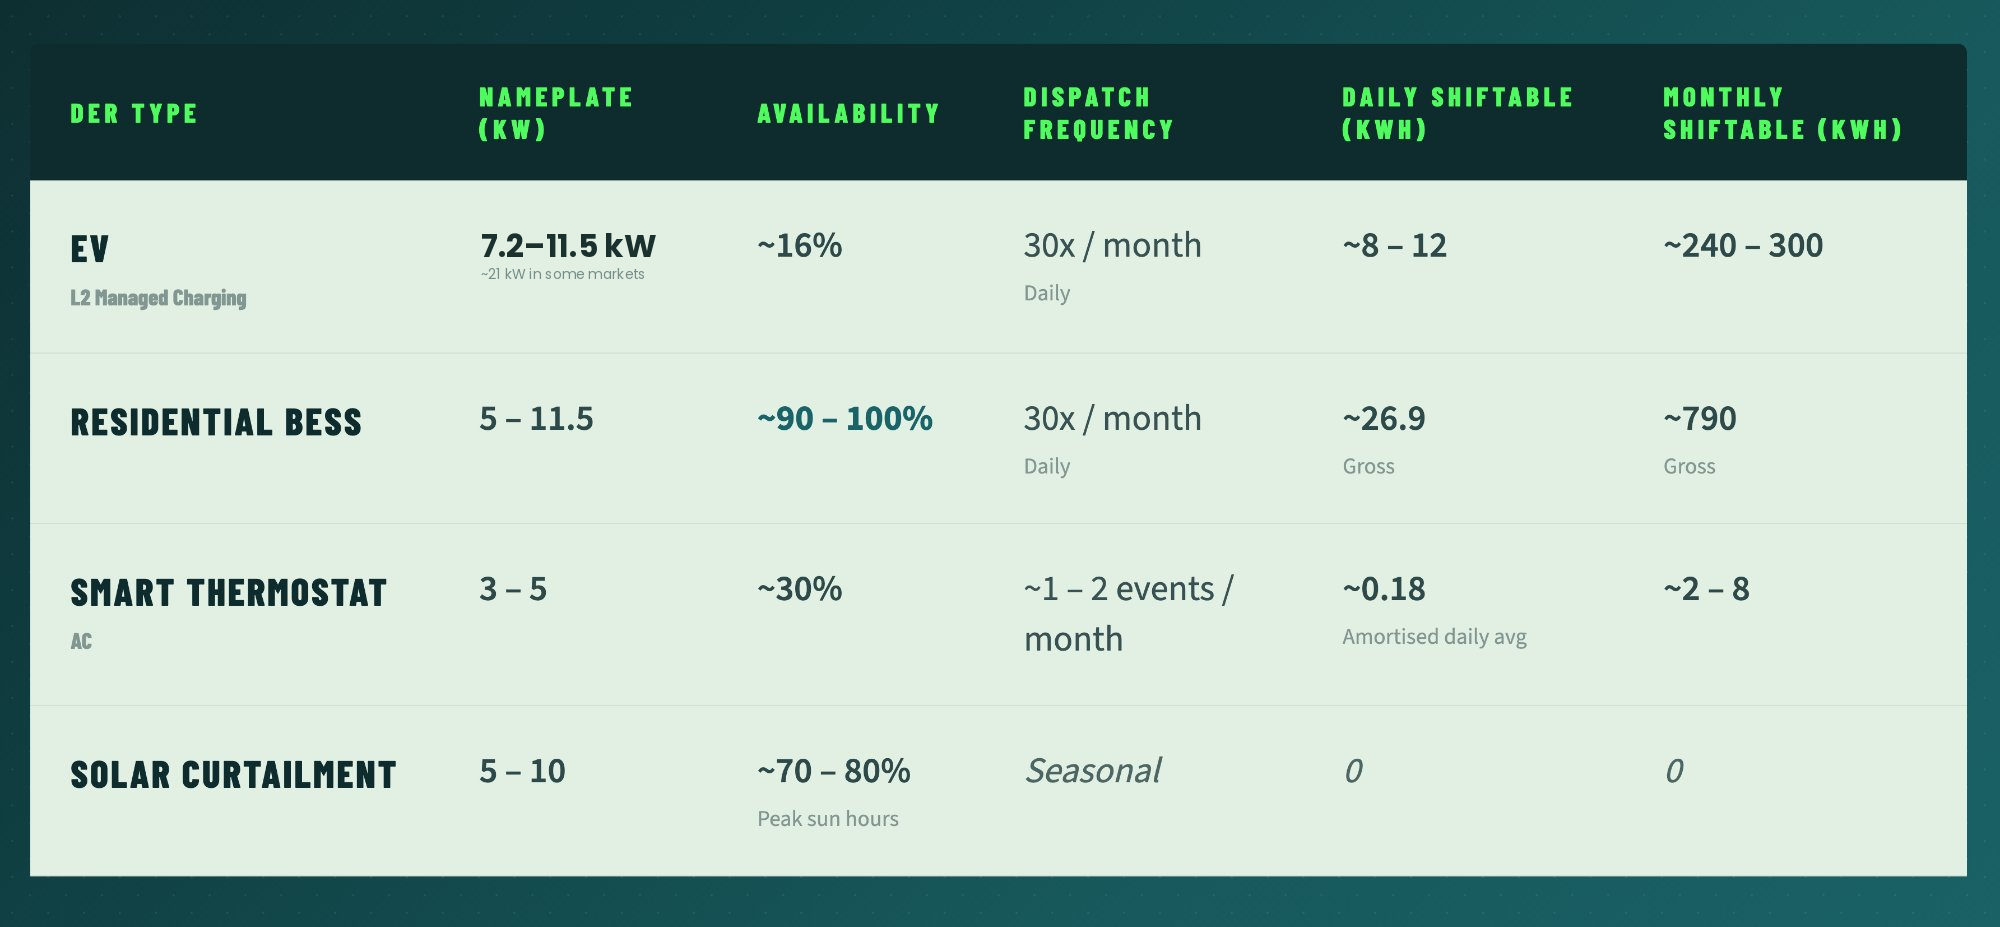
These are modelled values, based on typical program configurations and load shapes. Your exact numbers will vary, but the relative differences are what matter.
The load shape tells the story: 44% peak reduction, no new wires
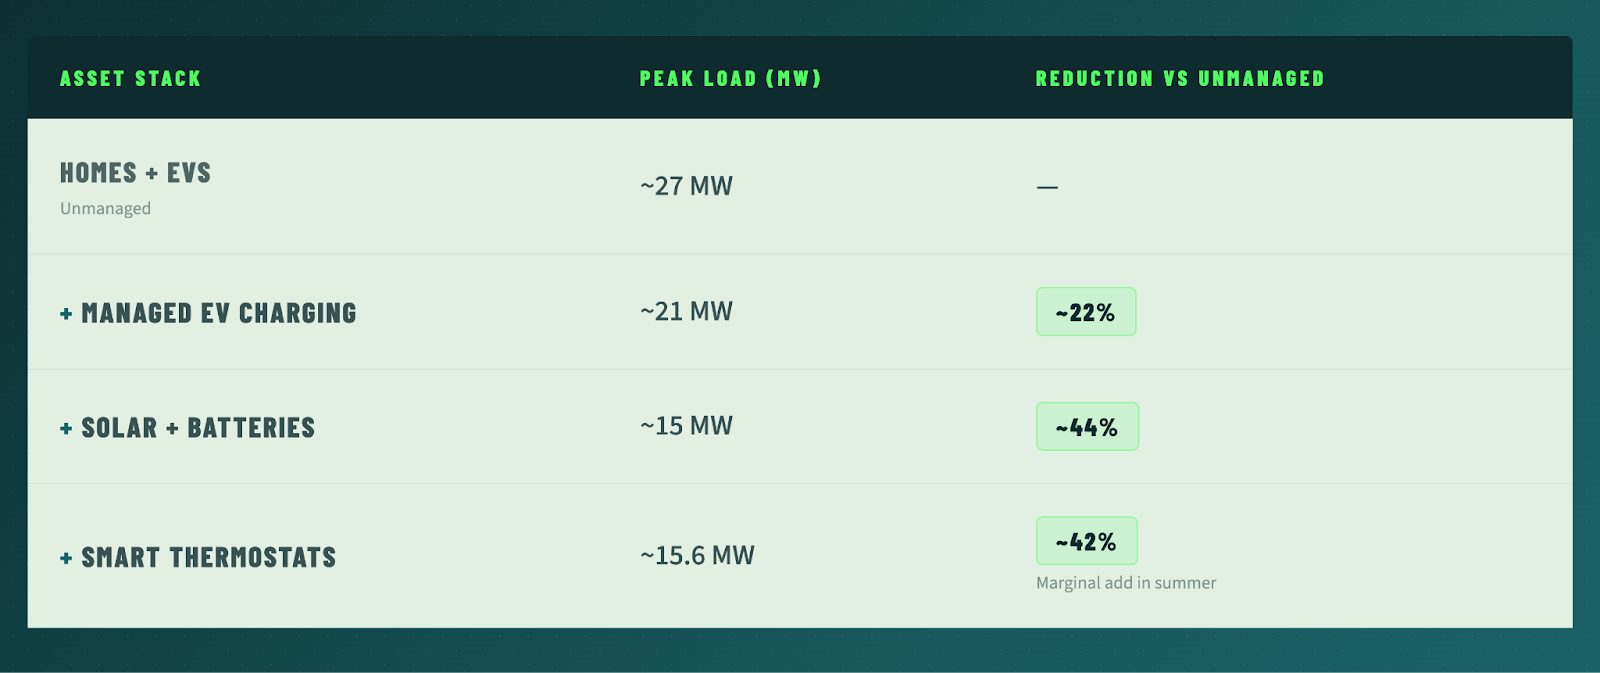
Here is what coordinated DER management actually looks like in practice. Imagine a typical residential feeder in 2030. EV penetration has reached 50% in some neighbourhoods — not science fiction, but a trajectory already playing out in parts of California, Norway, and the UK. A feeder serving 10,000 homes, with half those households owning an EV, has a very different load profile from the one it was designed for. Left unmanaged, that feeder peaks at around 27 MW — driven by the classic evening spike as commuters plug in simultaneously after work. That is a real infrastructure problem today, not a forecast.
Now introduce managed EV charging, a smart charging algorithm that shifts load away from the evening peak and into overnight valleys. The peak drops to around 21 MW. That single intervention, applied to the EV fleet alone, removes roughly 6 MW of stress from the grid at the moment it is most constrained. No new wires. No new substations. Just flexibility.
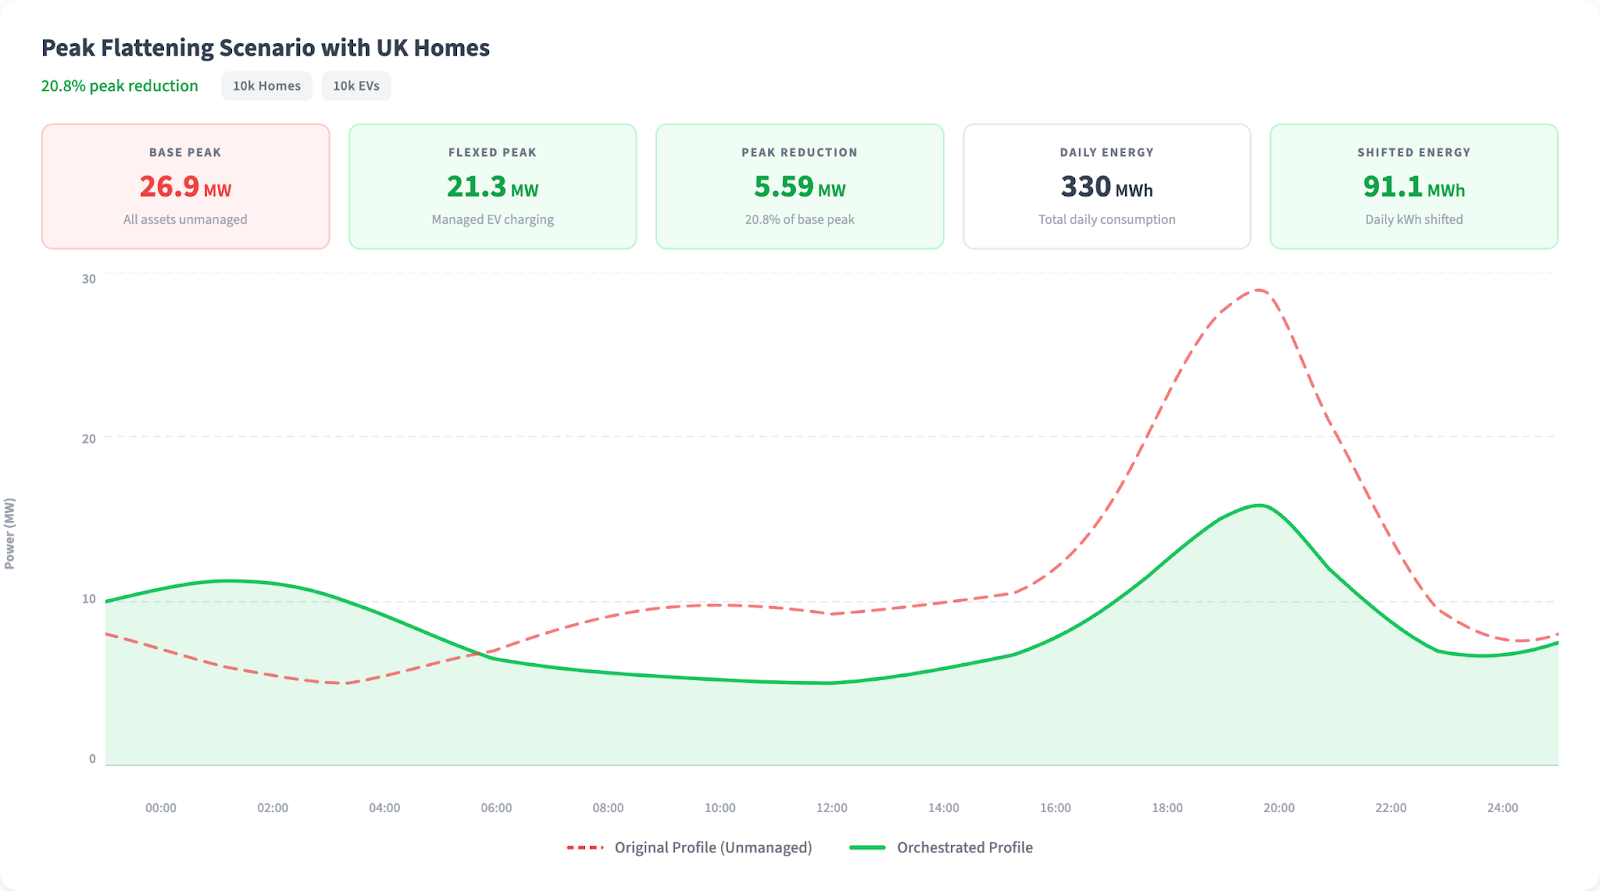
Headline numbers are abstractions. Load shapes are reality. And the new load arriving on distribution grids across the world is not a gradual transition; it's a step change.
The story gets even more interesting when you consider what happens to a neighbourhood where 50% of those same homes also have rooftop solar, and 50% have a residential battery. This is not a hypothetical; it describes the asset mix already present in parts of Australia, Germany, and increasingly across US Sun Belt states.
When you model all of those assets working together — smart EV charging, optimized battery dispatch, and solar generation absorbing midday load — the peak drops further, to around 15 MW. That is a 44% reduction from the unmanaged baseline. That’s almost half the peak load erased through coordination.
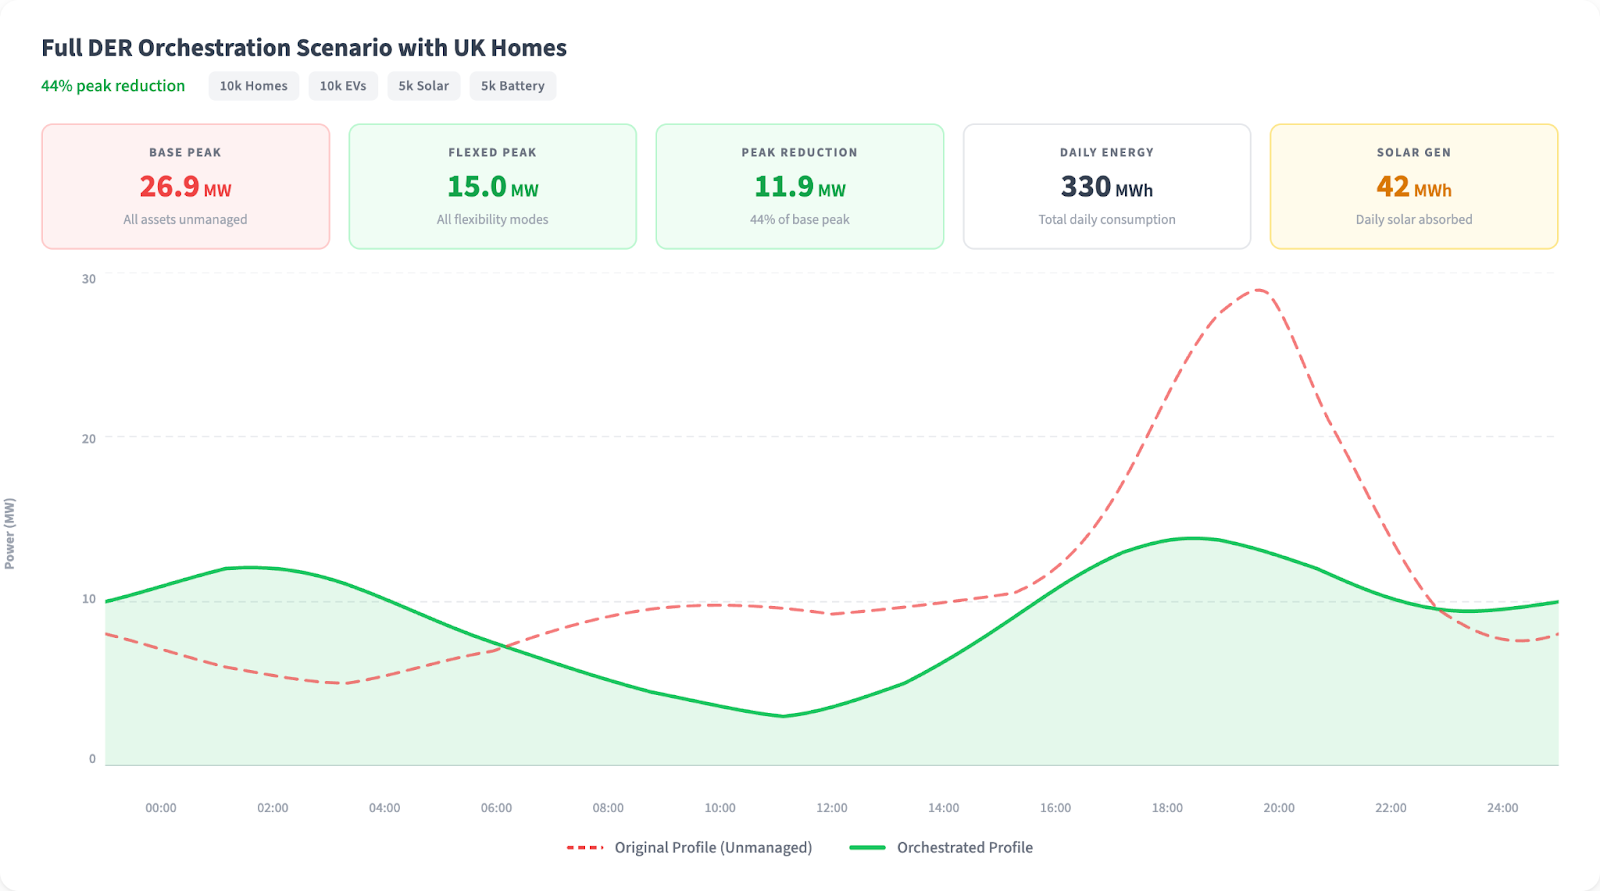
Smart thermostats contribute at the margin — adding roughly another 0.5 MW of peak reduction in a summer scenario, with more impact in winter when heat pumps are running. But the headline here is the EV and battery combination: those two asset classes, orchestrated together, do the heavy lifting.
This is not a distant grid future. It is the infrastructure challenge utilities are navigating right now, and the reason coordinated DER management — not just enrolled nameplate capacity — is the metric that matters.
The hidden cost: energy losses
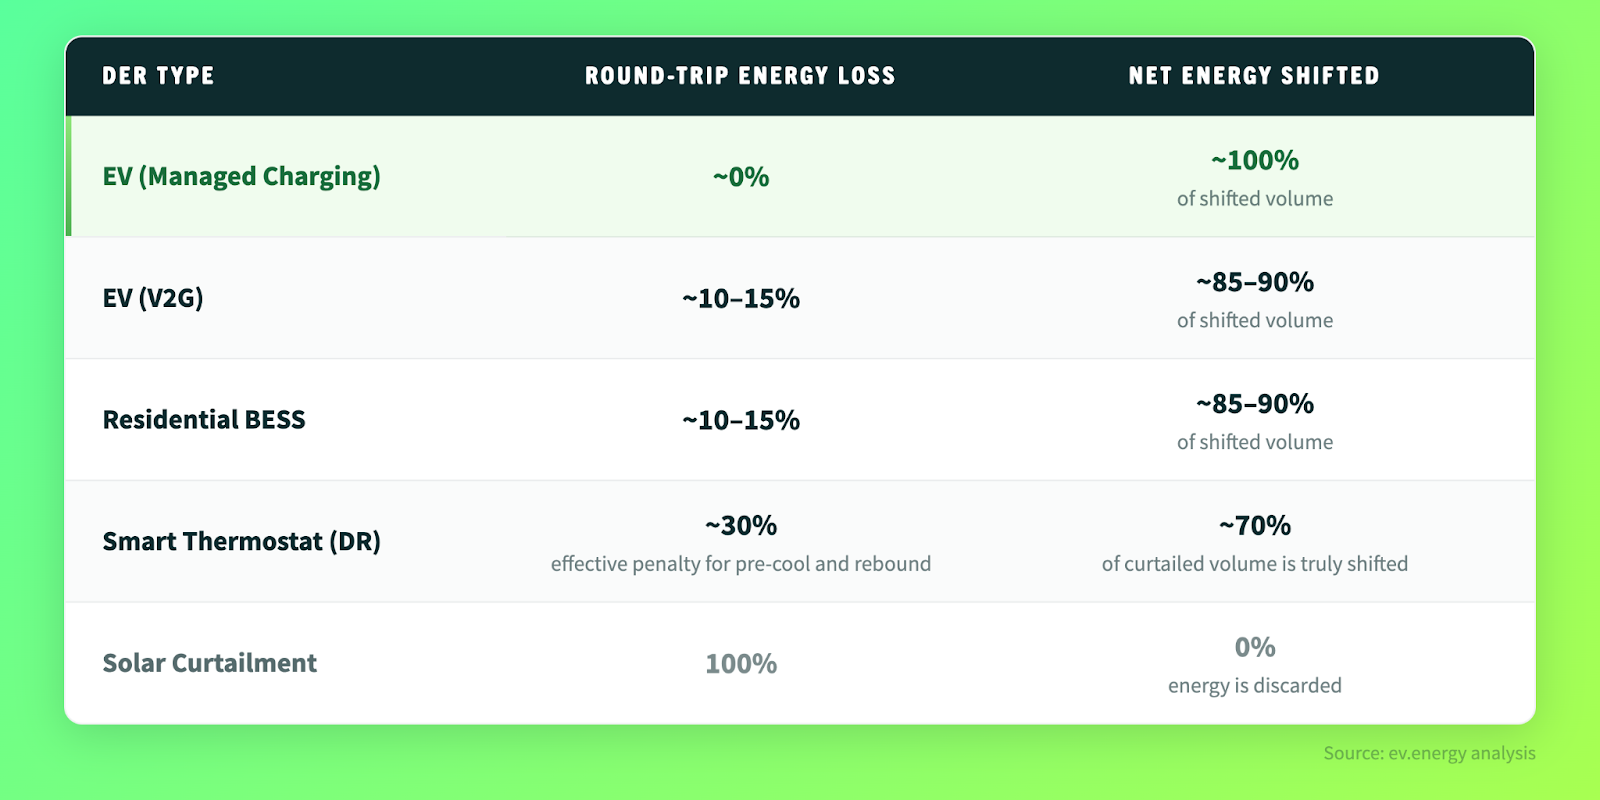
There’s another dimension the nameplate metric ignores entirely: round‑trip efficiency.
When a utility dispatches a thermostat DR event, the building must be pre‑cooled beforehand and will rebound‑heat afterwards. Our modelling of typical residential DR programs suggests around 30% additional energy use due to the pre-cooling and rebound cycle. You’re not shifting energy for free; you’re paying an energy “tax” to achieve a brief demand reduction.
EVs, by contrast, are essentially lossless in managed charging. Moving the same 10 kWh of charging from 6 pm to 2 am costs no additional energy. The electrons go into the battery with the same efficiency regardless of when they arrive. With V2G, round‑trip losses are modest (typically 10-15% AC‑to‑AC), comparable to stationary battery storage.
Solar curtailment is the limiting case. The energy is foregone, not shifted - curtailing 5 kW of solar production at midday doesn't create 5 kW of dispatchable capacity at 6 pm. It reduces generation during a period when the grid may not need it. That's a useful tool in specific circumstances, but it shouldn't count the same way as shiftable energy in a VPP stack.
Reframing the market: from GW to GWh
The Ohm Analytics 2025 VPP Market Report tracks 38.6 GW of enrolled nameplate capacity in U.S. VPPs. But what does that number actually represent in usable flexibility?
When you break that 38.6 GW down by technology as per the Ohm Analytics report and apply realistic diversity and dispatch‑frequency assumptions, you see that the ~10.5 GW of smart thermostats delivers huge nameplate numbers but relatively modest shiftable energy per device, while the smaller residential segments – 2.2 GW of BESS and a few hundred megawatts of active managed EV charging – punch far above their weight in GWh terms.
This isn't an argument against thermostats. They are valuable assets, particularly for emergency peak shaving. However, it does highlight that the industry needs a richer vocabulary for describing what VPPs can do, and that vocabulary should centre on energy, not just power.
The comparisons in this post use a consistent set of assumptions across DER types to illustrate relative performance. Actual results will vary by utility, climate, and program design — but the hierarchy remains: EVs and batteries deliver far more usable flexibility per enrolled device.
What this means for utilities
For a utility evaluating VPP program design, the implications are significant:
- Program value should be measured in $/kWh shifted, too, not just $/kW enrolled. A managed charging program that delivers 300 kWh of monthly shiftable energy per vehicle can be more valuable to utilities than a thermostat program that delivers only a few kWh per device per month — even if the thermostat program has higher nameplate capacity.
- EVs and residential batteries are still undervalued in the VPP stack. With daily shiftable energy, high round‑trip efficiency and, in the case of batteries and V2G, the potential for bidirectional power flow, they deliver far more usable flexibility per enrolled kilowatt than traditional thermostat DR programs alone.
- Diversity factors must be disclosed and standardized. When one provider reports 7 kW per EV and another reports 1 kW, they might both be correct — but they’re measuring fundamentally different things. The industry needs agreed conventions for reporting enrolled nameplate kW, after‑diversity dispatchable kW, and shiftable kWh for each asset class.
- V2G transforms the economics. Adding bidirectional capability to an EV doesn’t just add export capacity — it converts a flexible load into a dispatchable generation asset with a battery larger than most residential storage systems. A 60 kWh EV battery is 4–6× the capacity of a typical home battery. At scale, V2G‑enabled EVs could deliver more dispatchable storage capacity than the entire residential BESS fleet.
Standardising VPP metrics for the GWh era
38.6 GW of enrolled nameplate capacity is a milestone worth celebrating, and we’re proud to play our part at ev.energy with leading utilities like Con Edison, National Grid, and MCE.
The next phase of VPP maturity requires the industry to move beyond nameplate capacity as the defining metric.
The question isn’t how many kilowatts are enrolled, it’s how many kilowatt‑hours can be shifted, how often, how reliably, and at what cost. When you ask that question, and when you standardise on nameplate capacity, dispatchable capacity, and shiftable energy, the answer increasingly points to EVs and batteries as the backbone of the future VPP. That’s not because they have the largest nameplate capacity today, but because they deliver the most usable flexibility per enrolled device, every single day, with the lowest energy losses.
The GW era of VPP measurement got the industry started. The GWh era is where it will deliver real, tangible value at scale to utilities and their customers.
What’s the value of DER orchestration for your utility? Don’t wait months or years to find out. Model your unique scenario in minutes with ev.energy AI. Book a demo today.
Modeling Assumptions
This analysis was produced using ev.energy AI, which models load shapes and flexibility potential across millions of connected devices. Is your utility, VPP operator, and industry body interested in our methodology for calculating VPP capacity? Reach out to learn more.
Modelling assumptions and data sources:
- EV L2 nameplate: typically 7.2–11.5 kW, corresponding to 32–48 A @ 240 V single‑phase, with higher‑power home chargers up to ~21 kW in some markets.
- EV average daily energy consumption: 8–12 kWh (based on ~30 miles/day average)
- EV dispatchable capacity: ~1.0–1.25 kW after diversity (based on plug‑in rates, SoC distribution, and charging flexibility window)
- Thermostat dispatchable capacity: ~1.0 kW (based on 3–5 kW nameplate with ~25% coincidence factor)
- Thermostat dispatch frequency: typically 1–2 events per month
- Thermostat pre‑cooling/rebound penalty: around 30% additional energy use vs curtailed volume
- BESS round‑trip efficiency: 85–90% (AC‑coupled systems)
- V2G round‑trip efficiency: 85–90% (AC‑to‑AC, including inverter losses)
- Sources: ev.energy platform data, Ohm Analytics 2025 VPP Market Report (January 2026), DOE Connected Communities program data, utility program filings
%20(1).png)